Inventory Visibility
Part of In-store customer analytics
Comparing sensor readings with manual observations
Set matching event rules and observation windows, reconcile missed or extra counts, and report uncertainty before relying on store sensor data.
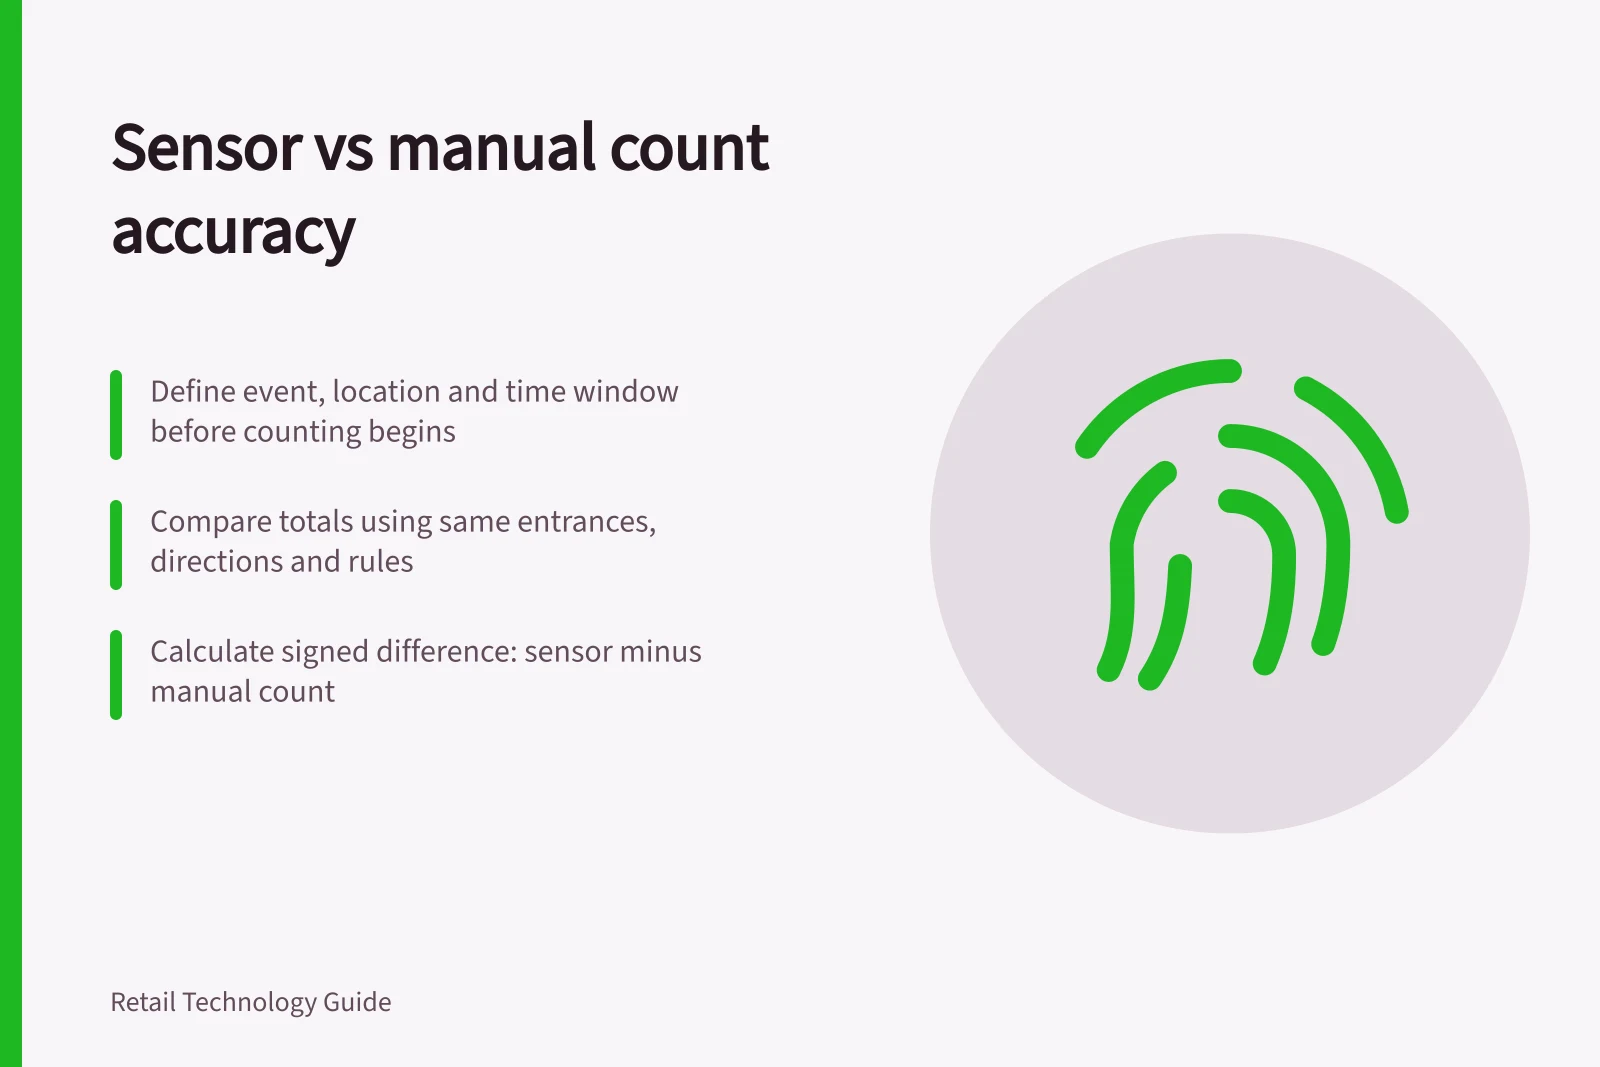
Compare a store sensor with an independent manual record of the same event, place and time window. Define the event before either method starts.
Two totals cannot show a meaningful counting difference if they use different entrances, directions, exclusions or clocks.
Write an observation rule
For a door counter, mark the counting line and define an entry. Set rules for staff, deliveries, groups, children, trolleys, people who pause at the line, and those who leave and return.
If the sensor reports visits rather than crossings, obtain its visit rule before comparing it with a manual tally.
For a queue system, define joining, starting service, changing lanes and leaving before service.
Queue length at a moment and completed waiting time need separate comparisons. Observers should record the events and times needed for the chosen measure.
Sample relevant conditions
Use matching short windows and synchronised clocks. Include ordinary and busy trading, groups entering together, staff movement and layouts likely to challenge the sensor.
Record lighting, obstructions, open tills, device status and layout changes. Report an outage separately from a genuine zero count.
Give observers a tally sheet with the event rule, location, window, direction and exception notes. Where practical, have two observers independently record a shared window.
Disagreement may expose an unclear definition; keep uncertain windows visible. Manual observation is a reference for this comparison, not an infallible record.
Reconcile before calculating
Match records by location and window. Compare totals, then inspect where differences arose.
A low sensor count during group entry may suggest overlapping people; a high count at a threshold may suggest repeated crossings. These are possibilities to investigate, not findings about a device.
| Measure | Report together |
|---|---|
| Door entries | Manual and sensor totals, plus their difference, by window |
| Direction | Entries and exits separately |
| Queue length | Paired readings at the same moments |
| Wait | Matched join and service events where available, with missing events shown |
| Availability | Windows without valid sensor output, apart from counting errors |
For a defined sample, calculate the signed difference as sensor count minus manual count. If a percentage is useful, divide that difference by the manual count and show both totals. When the manual count is zero, report the counts without a percentage.
An overall figure can conceal persistent errors at a particular doorway or trading period.
Key Metrics for Sensor and Manual Observation Comparison
- Signed difference (sensor - manual)
- Calculated for defined sample
- Manual count = 0
- Report counts without percentage
- Persistent error risk
- Can be hidden by overall figures
Decide what the comparison supports
Record any change to sensor position, counting line, settings or event rules. Compare a fresh sample after the change; retain the earlier readings as recorded.
Judge whether remaining uncertainty affects the intended decision. A rough staffing signal and a claimed person-by-person path demand different evidence.
Keep the observation sheet, sensor export, configuration and unresolved cases together. Repeat relevant checks after a layout or equipment change.